



CRO for UK law firms
We get more of your visitors to enquire.
You already pay to bring potential clients to your website. We find where your key pages lose them, then fix and test, so more visits become enquiries without more spend.
See your conversion score, page by page, worst first
Generate your Client Acquisition Map- Free map
- 90 seconds to start
- Reviewed by a senior strategist
Is CRO right for your firm?
This service is built for
- Law firms with a reasonable volume of website traffic but fewer enquiries than expected
- Partners who want clear, data-driven insight into what happens on their key pages
- Firms investing in SEO, PPC or other marketing who want a better return on that spend
Probably not the right first step
- Sites with very little traffic yet: a test needs visits to reach a conclusion
- Sites with fundamental design or UX problems, where website and UX work comes first
- Firms that need more visitors before more enquiries: that is SEO, PPC or paid social first
Marketing costs have risen sharply, so getting more from the traffic you already have is often the fastest win. Small conversion improvements on key pages can translate into meaningful increases in new matters, and they make every other channel more efficient: SEO, PPC, AI search, social and referrals all send visitors to the same pages. The data from the work also feeds back into your messaging, your intake process and how you position each service.
CRO cannot fix a page that nobody visits, and it cannot fix a site whose structure is the problem: testing a headline on a page a client cannot find, or cannot use on a phone, moves nothing. If your site receives very little traffic or has fundamental design or UX issues, website and UX work may be a better first step. If you already attract visitors and want to turn more of them into high-quality instructions, this is for you.
How our CRO programme works
Measurement setup
We set up or refine your analytics and your call and form tracking, so every enquiry route is measured.
The map sets the baseline. It is built from your own data, read-only Search Console with Google Analytics and Google Ads if you want them, plus a crawl of your site, so the numbers the programme is judged against are yours from the first day.
Conversion audit
We review your key pages, user flows, device breakdowns and drop-off points. That points to the areas with the biggest potential impact on enquiries.
The map does the first pass before we start: every commercial page in a crawl of up to 1,000 pages is scored on contact routes, calls to action, trust evidence, pricing and speed, and listed worst first. The audit begins from that list, not from a blank page.
Hypothesis and test plan
We write a clear CRO plan for your most important pages: the homepage, key practice areas, and the contact and enquiry routes. It sets out specific hypotheses to test, such as alternative headlines, layouts, proof elements and calls to action.
The order comes from the map: the pages losing the most enquiries are tested first, so the earliest gains are the biggest. If you buy the 90-day plan, the fix list is written out in full, page by page and in order, ready for your developer or ours.
Implementation and A/B testing
We implement controlled changes and A/B tests, keeping the messaging accurate and compliant. Each test runs long enough to show which version brings in more qualified enquiries.
Compliant means written inside the SRA Transparency Rules from the first draft, so a winning variation never has to be pulled and rewritten after it goes live. Where the rules ask for price information to be published for a service, the page carries it before the test starts.
Rollout, reporting and iteration
We roll out the winning variations across your site and report in plain English on what changed and why it worked. Then we keep testing and refining, so conversion rates improve over time rather than staying static.
The 90-day plan includes a full re-run of the map at day 90: the same pages, scored the same way, so what moved is shown against the first map rather than described. If you would rather we did the work, that is the 90-day pilot: our team implements the plan and reports what moved.
Outcomes you can expect
Our goal is simple: more qualified enquiries from the visitors you already have.
A higher percentage of visitors completing calls, forms or consultation requests
Measured against the baseline set in step one, from your own analytics and your call and form tracking, so the gain is a number rather than an impression.
Clearer journeys on high-value practice-area and location pages
These are the pages the map lists worst first, because they are where the most enquiries are being lost.
Less friction in forms and contact options, especially on mobile
Contact routes and calls to action are two of the five checks in the map's conversion score, so the change shows in the day-90 re-run.
A clear picture of which messages, layouts and calls to action work best with your ideal clients
Evidence from your own tests, which feeds back into your messaging, your intake process and how you position each service.
Results, from the firm's own numbers

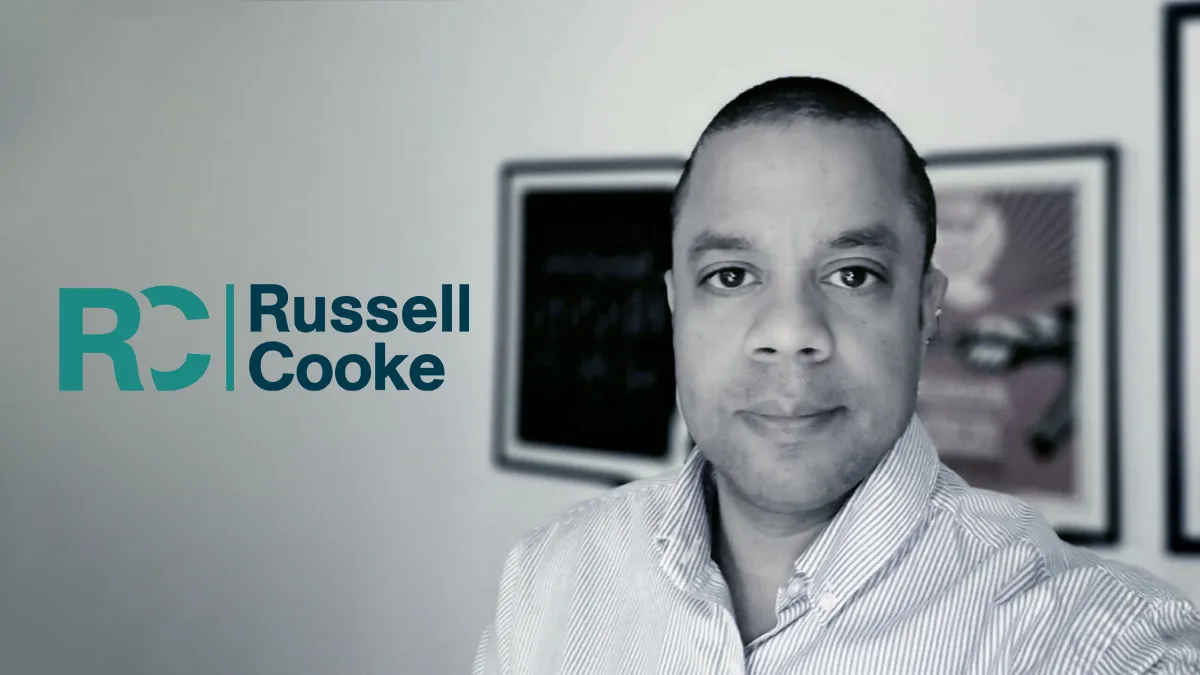

Crescat have transformed how we show up online, for example our Q2 reports show our new users grew by 26%, and leads more than doubled, with conversion rates improving by over 50%
Alvin Holder Digital Marketing Manager, Russell Cooke

- +50%conversion rate
Note: The +50% is Russell Cooke's conversion-rate gain, in Alvin Holder's own words from the firm's Q2 reports, and it is the one figure of his that belongs to this service. The same sentence also names new users and leads; those figures sit on the service pages they are matched to.
Written inside the SRA Transparency Rules from the first draft.

Packages from £2,800 a month, with a 50% lead-growth target and a service-credit guarantee from Tier 2.
See packagesQuestions firms ask about CRO
How is CRO different from website design and UX?
Website design and UX builds or rebuilds the site. CRO works on the site you already have. It measures how visitors behave on your key pages, tests specific changes and keeps the ones that bring more enquiries.
The order matters. Testing a headline on a page a client cannot find, or cannot use on a phone, moves nothing, so structure and usability come first and CRO follows. If the audit finds a problem that testing cannot fix, we say so and point you to the website work first.
The map scores both from the same data. Every commercial page gets a conversion score built from five checks, and the list of pages, worst first, usually makes it clear whether the site needs rebuilding or the pages need improving.
Do we need a lot of traffic for A/B testing to work?
You need enough visits for a test to tell a real difference from chance. A test compares two versions of a page on the enquiries each one produces, and the fewer visits the page gets, the longer it takes for a gap between them to be believable. That is why the fit statement above rules out sites with very little traffic.
Where a key page does not get that many visits, we do not pretend to test. We make the changes the evidence supports, measure before and after with the call and form tracking set up in step one, and report the difference plainly.
If the real problem is too few visitors, the answer is SEO, PPC or paid social first, and the map will show that too: demand and conversion are scored side by side in the same report.
What does the map show for conversion?
Every commercial page on your site, scored on its ability to convert. The score is built from five checks: whether there is a clear route to contact, whether the call to action is obvious, whether trust evidence is where a client expects it, whether pricing is shown where the rules and the client expect it, and how fast the page loads.
Pages are listed worst first, so you can see where enquiries are lost before anyone touches the site. Worst first matters because the biggest gain is usually on a busy page with a low score, not on the page you happen to be redesigning. The crawl covers up to 1,000 pages.
Conversion is one of the six pillars in your Client Acquisition Score, alongside demand, AI answers, authority, technical health and paid efficiency, so you see it in proportion to everything else. A senior strategist reviews the map before you see it.
Will you work with our existing developer?
Yes. Every change is specified in plain English so your developer or CMS team can implement it, and we check the result once it is live. A/B tests need a way to show two versions of a page, and we agree that with your developer before the first test rather than working around them.
The 90-day plan is written for exactly that handover: the full fix list in order, with new titles, descriptions and headings ready to upload as a CSV, so the work can start the day it arrives.
If you would rather we did the work, that is the 90-day pilot: our team implements the plan and reports what moved. It is quoted on a call, never on a checkout page.
How long until conversion rates improve?
It depends on how much traffic your key pages get. The more visits, the sooner a test reaches a conclusion, and the sooner a winning version can be rolled out across the site.
The map comes first and shows which pages lose the most enquiries, so the first changes go where the gain is biggest. Some of them need no test at all, such as a missing contact route or a hidden call to action on a busy practice-area page, and those go live early while the tests that need weeks of visits run alongside them.
The 90-day plan is built to that horizon and includes a full re-run of the map at day 90: the same pages, scored the same way, so what moved is shown against the first map rather than described. The free walkthrough call that comes with every map is where we set the expectation for your firm, from your own numbers.